

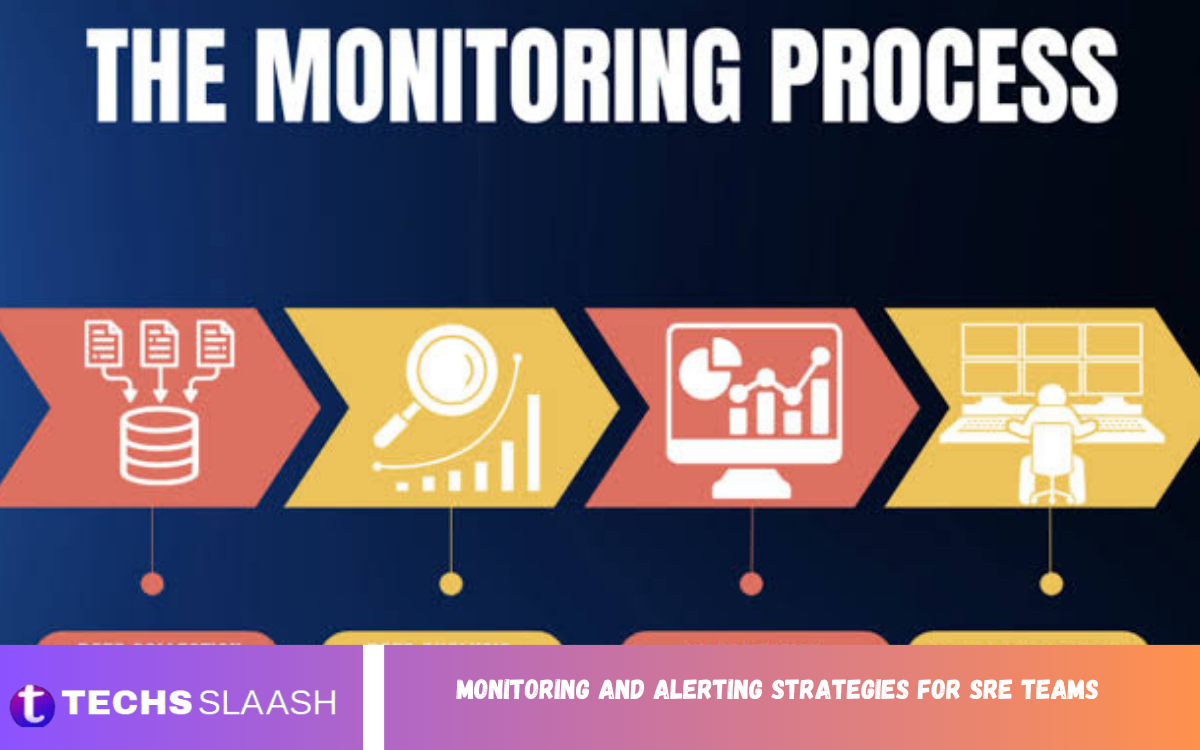
Monitoring and alerting are the foundation of successful Site Reliability Engineering (SRE). As modern applications become increasingly distributed across cloud platforms, containers, and microservices, maintaining high availability and performance requires more than simply collecting system metrics.
A well-designed monitoring and alerting strategy goes beyond tracking CPU usage or memory consumption. It focuses on Service Level Indicators (SLIs), Service Level Objectives (SLOs), error rates, latency, availability, and overall system health. By combining meaningful metrics with intelligent alerting, organizations can eliminate alert fatigue, prioritize critical incidents, and accelerate response times.
What Is Site Reliability Engineering (SRE)?
Site Reliability Engineering is a discipline that applies engineering principles to IT operations. Created by Google, SRE focuses on automating operational tasks while maintaining system reliability and scalability.
SRE teams are responsible for:
- Maintaining application uptime
- Improving system performance
- Managing incidents
- Automating repetitive operations
- Measuring service reliability
- Reducing operational risks
Monitoring and alerting serve as the foundation for all these responsibilities.
Why Monitoring Is Critical for SRE Teams?
Monitoring provides continuous visibility into every component of a system. Instead of waiting for customer complaints, engineers receive immediate insight into infrastructure health and application performance.
Benefits include:
- Early problem detection
- Reduced downtime
- Faster troubleshooting
- Better capacity planning
- Improved customer experience
- Increased operational efficiency
- Data-driven decision making
Without comprehensive monitoring, organizations operate blindly and often discover issues only after they affect users.
Understanding Observability
Monitoring is only one part of observability.
Observability enables engineers to understand what is happening inside complex systems by analyzing three primary data sources:
Metrics
Metrics measure numerical values over time.
Examples include:
- CPU usage
- Memory utilization
- Disk usage
- Request latency
- Error rates
- Network throughput
Metrics help identify trends before problems become severe.
Logs
Logs provide detailed event records generated by applications and infrastructure.
They help engineers investigate:
- Errors
- Warnings
- User activity
- Authentication failures
- System events
Traces
Distributed tracing follows requests as they move across multiple services.
Tracing helps identify:
- Slow services
- Failed API calls
- Database bottlenecks
- Microservice dependencies
Combining metrics, logs, and traces creates complete visibility across modern cloud environments.
Key Metrics Every SRE Team Should Monitor
Successful Monitoring and Alerting Strategies for SRE Teams focus on meaningful performance indicators.
Important metrics include:
Availability
Measure service uptime.
Examples:
- 99.9%
- 99.95%
- 99.99%
Availability directly affects customer satisfaction.
Latency
Latency measures how quickly systems respond.
Monitor:
- API response time
- Database queries
- Page load speed
- Network delays
Lower latency improves user experience.
Error Rate
Track:
- HTTP 500 errors
- Failed requests
- Application exceptions
- Database failures
A rising error rate often indicates underlying issues.
Resource Utilization
Monitor infrastructure resources such as:
- CPU
- RAM
- Storage
- Bandwidth
High utilization can reduce application performance.
Traffic
Measure:
- Requests per second
- Active users
- Transaction volume
- API calls
Traffic patterns help predict future capacity needs.
Service Level Indicators (SLIs)
SLIs measure actual service performance.
Examples include:
- Request success rate
- Availability
- Latency
- Throughput
These measurements determine whether services meet reliability expectations.
Service Level Objectives (SLOs)
SLOs define acceptable performance targets.
Example:
- 99.95% uptime
- API latency below 200 ms
- Error rate under 0.1%
SLOs help prioritize engineering work and guide alerting decisions.
Error Budgets
Error budgets allow controlled risk while maintaining reliability.
If the service achieves its SLO, developers can safely release new features.
If the error budget is exhausted, engineering efforts shift toward improving reliability instead of deploying additional changes.
Error budgets balance innovation with operational stability.
Designing Effective Monitoring Systems
Monitoring should cover every system layer.
Infrastructure Monitoring
Track:
- Servers
- Virtual machines
- Kubernetes clusters
- Cloud resources
- Storage
- Networking
Infrastructure monitoring prevents hardware-related failures.
Application Monitoring
Application monitoring measures:
- API performance
- Application errors
- Response times
- Business transactions
- User sessions
This provides visibility into software behavior.
Database Monitoring
Databases require continuous monitoring of:
- Slow queries
- Connection counts
- Replication health
- Storage capacity
- Lock contention
Database failures frequently affect entire applications.
Network Monitoring
Monitor:
- Packet loss
- Latency
- DNS performance
- Firewall activity
- Connectivity issues
Network health directly influences application availability.
Read Also: Adriana Janae Jewelries: Timeless Elegance
Characteristics of Good Alerts
Poor alerting creates unnecessary noise.
Effective alerts should be:
Actionable
Every alert should require immediate investigation.
Accurate
False alarms waste valuable engineering time.
Prioritized
Critical incidents should receive higher urgency than informational notifications.
Timely
Alerts should trigger before customers experience service degradation.
Contextual
Include:
- Error details
- Affected services
- Suggested remediation
- Related dashboards
- Runbooks
Context accelerates incident response.
Avoiding Alert Fatigue
Alert fatigue occurs when engineers receive excessive notifications.
Reduce alert fatigue by:
- Removing duplicate alerts
- Using intelligent thresholds
- Eliminating low-priority alerts
- Grouping related incidents
- Creating maintenance windows
- Regularly reviewing alert quality
Fewer, higher-quality alerts improve response effectiveness.
Alert Severity Levels
Many organizations classify alerts into multiple severity levels.
Critical
Immediate response required.
Examples:
- Complete outage
- Security breach
- Database failure
High
Major service degradation requiring urgent attention.
Medium
Performance issues with limited customer impact.
Low
Informational alerts requiring future review.
Severity-based alerting improves incident prioritization.
Choosing Alert Thresholds
Static thresholds often produce false positives.
Modern SRE teams combine:
- Historical trends
- Baseline analysis
- Dynamic thresholds
- Machine learning
- Seasonal traffic patterns
Adaptive alerting improves accuracy significantly.
Automation in Monitoring
Automation increases operational efficiency.
Examples include:
- Automatic incident creation
- Self-healing infrastructure
- Auto-scaling
- Automated diagnostics
- Restarting failed services
- Running recovery scripts
Automation reduces manual intervention and speeds recovery.
Incident Response Integration
Monitoring should integrate with incident management workflows.
Typical workflow:
- Monitoring detects issue.
- Alert triggers notification.
- Incident ticket created.
- On-call engineer responds.
- Root cause identified.
- Service restored.
- Post-incident review completed.
Well-defined workflows reduce Mean Time to Resolution (MTTR).
Popular Monitoring Tools
Many organizations use specialized monitoring platforms.
Common solutions include:
- Prometheus
- Grafana
- Datadog
- New Relic
- Dynatrace
- Elastic Stack
- Splunk
- Nagios
- Zabbix
- Azure Monitor
- Amazon CloudWatch
- Google Cloud Operations Suite
Many SRE teams combine multiple tools to achieve full-stack observability.
Dashboard Best Practices
Dashboards should provide clear operational visibility.
Include:
- Service health overview
- Real-time metrics
- Error trends
- Infrastructure utilization
- Deployment history
- Alert status
- Business KPIs
Avoid clutter by displaying only actionable information.
Monitoring Cloud-Native Applications
Cloud-native environments introduce additional complexity.
Monitor:
- Containers
- Kubernetes Pods
- Service Mesh
- Serverless functions
- APIs
- Load balancers
- Distributed storage
Cloud monitoring requires dynamic discovery because resources frequently change.
Security Monitoring
Reliability also depends on security.
Monitor:
- Failed logins
- Unauthorized access
- Suspicious network traffic
- Privilege changes
- Malware detection
- Configuration changes
Security monitoring protects infrastructure while supporting compliance.
Continuous Improvement
Monitoring strategies should evolve over time.
Review regularly:
- Alert effectiveness
- Incident trends
- Dashboard usefulness
- SLO performance
- Infrastructure growth
- Monitoring coverage
Continuous optimization keeps monitoring aligned with changing business requirements.
Best Practices for Monitoring and Alerting Strategies for SRE Teams
Follow these proven practices:
- Monitor customer experience, not just infrastructure.
- Build alerts around SLOs instead of individual metrics.
- Eliminate noisy alerts.
- Continuously test monitoring systems.
- Automate repetitive operational tasks.
- Use centralized dashboards.
- Collect metrics, logs, and traces together.
- Review incidents after every outage.
- Improve alert thresholds using historical data.
- Maintain clear runbooks for responders.
- Regularly update monitoring documentation.
- Train engineers on incident response procedures.
These practices improve reliability while reducing operational complexity.
Future Trends in SRE Monitoring
Monitoring technologies continue evolving rapidly.
Emerging trends include:
- AI-powered anomaly detection
- Predictive analytics
- Autonomous incident remediation
- Intelligent alert correlation
- Observability-driven development
- OpenTelemetry adoption
- AIOps platforms
- Real-time business observability
These innovations enable SRE teams to identify problems earlier and resolve incidents faster than ever before.
Frequently Asked Questions
What are SLIs and SLOs?
SLIs measure service performance, while SLOs define the reliability targets those measurements should achieve.
How can SRE teams reduce alert fatigue?
By eliminating unnecessary alerts, using intelligent thresholds, prioritizing incidents, and reviewing alert quality regularly.
Which metrics should SRE teams monitor?
Key metrics include availability, latency, error rate, throughput, CPU usage, memory utilization, and network performance.
What tools are commonly used for SRE monitoring?
Popular tools include Prometheus, Grafana, Datadog, New Relic, Dynatrace, Splunk, Elastic Stack, and Amazon CloudWatch.
What is an error budget?
An error budget is the acceptable amount of service unreliability allowed while still meeting SLOs, helping balance innovation and stability.
How does automation improve monitoring and alerting?
Automation enables self-healing, auto-scaling, automatic incident creation, and faster recovery with minimal manual intervention.
What is the biggest benefit of effective monitoring and alerting?
The biggest benefit is proactive issue detection, which reduces downtime, improves customer satisfaction, and ensures reliable service performance.
Conclusion
Implementing effective Monitoring and Alerting Strategies for SRE Teams is essential for maintaining highly available, resilient, and scalable digital services. Modern organizations cannot rely on reactive operations; they need proactive monitoring, intelligent alerting, comprehensive observability, and automated incident response to deliver consistent customer experiences.
