

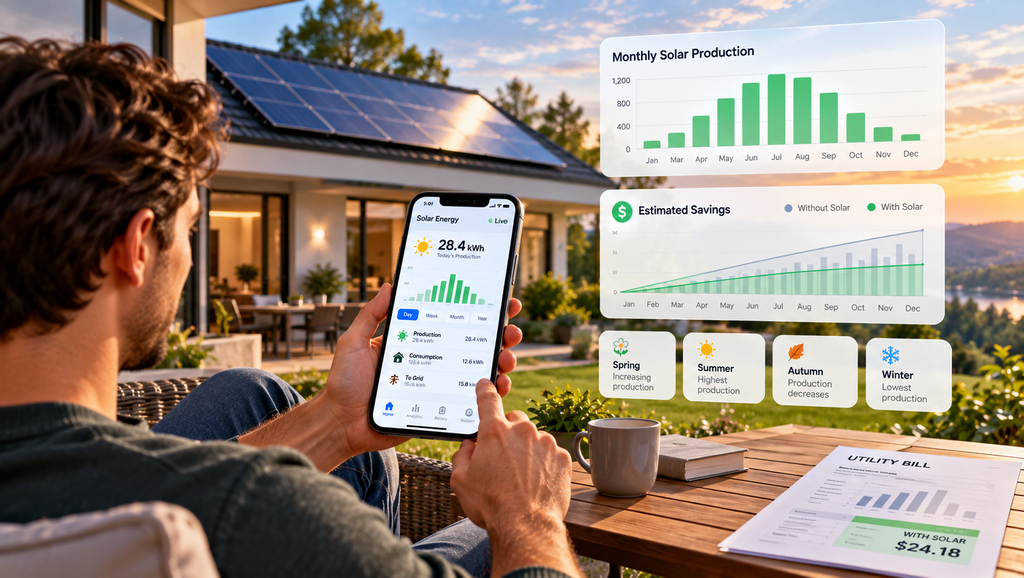
Every Solar Energy World system includes access to a live monitoring app at no extra charge, a detail worth noting since some installers bill separately for the same feature. That app becomes the main tool for understanding what a first year of solar actually looks like, which tends to be less predictable month to month than most new homeowners expect.
What Your First Utility Bill Actually Looks Like
The first bill after activation often confuses new solar homeowners, and it’s rarely because something went wrong. Utility billing cycles don’t line up perfectly with a system’s activation date, so the first statement frequently covers a mix of pre-solar and post-solar usage, sometimes with a partial month of production that makes the numbers harder to interpret.
The second and third bills give a much clearer picture, once a full billing cycle reflects solar production from start to finish. Comparing month one to a full year of history isn’t a fair test of how the system performs.
How Net Metering Credits Build Over Your First Year
Production isn’t flat across twelve months. Systems generate the most electricity in late spring and summer, when days are longer and the sun sits higher in the sky, and less in November through February. Net metering is what makes that seasonal swing work in a homeowner’s favor: excess production during high-output months earns credits that carry forward and offset usage once production drops in winter.
A homeowner who only looks at a single winter bill without accounting for summer credits can get a misleading picture of how the system is actually performing over a full year.
Using the Monitoring App to Track Real Performance
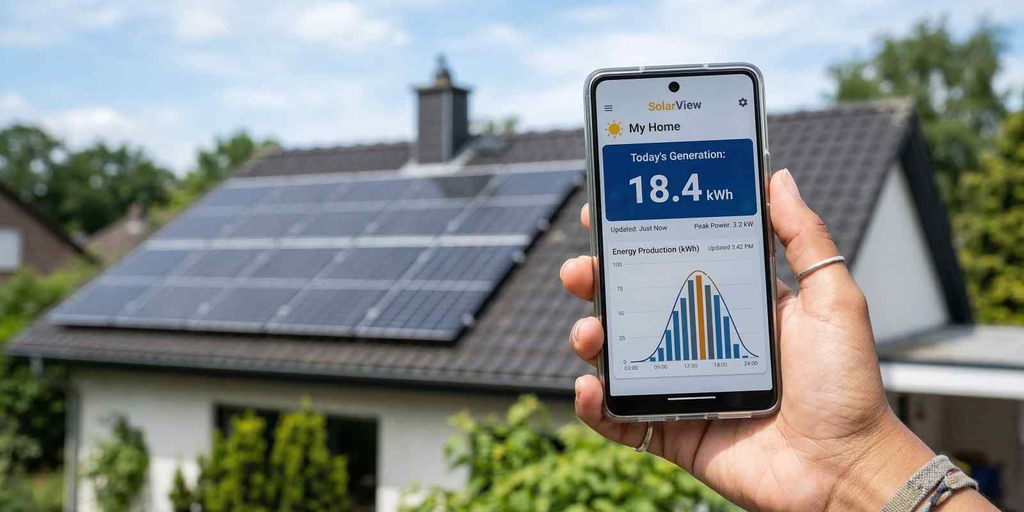
The monitoring app shows daily, weekly, and monthly production, along with consumption data and battery usage for homes with a battery installed. That visibility matters most in the first year, when a homeowner doesn’t yet have a personal baseline for what normal production looks like on a clear day versus a cloudy one.
Comparing actual production against the original estimate is the most useful habit to build early. A system tracking within a reasonable range of its projection is performing as expected, even if the raw numbers vary day to day with weather.
What Counts as Normal Seasonal Variation
New solar homeowners sometimes assume a production dip means a problem, when it’s actually just autumn or winter behaving the way autumn and winter behave. Shorter days, lower sun angles, and more cloud cover all reduce output during the colder months, and that pattern repeats every year regardless of how well a system is designed.
A meaningful, sustained drop that doesn’t match the season, like a 20% shortfall on a clear day, is the kind of signal worth investigating. A gradual seasonal decline through the fall is not.
Support That Doesn’t End at Activation
The app also handles service requests directly, so a homeowner who notices something that looks off can reach Solar Energy World’s service team without hunting for a phone number or separate portal. The same app stores important account documents, which keeps paperwork from year one accessible well into later years without a homeowner needing to track down physical copies.
That structure reflects a simple idea: activation is the start of the relationship with a system, not the end of the company’s involvement.
Referrals and Other Year-One Perks
Homeowners who are happy with their first year can use the same app to refer friends and family, earning a reward for referrals that convert. It’s a small feature, but it means the tool a homeowner already checks regularly for production data doubles as the easiest way to recommend the company to someone else.
Setting Realistic Expectations From Day One
A first year of solar rarely looks like a straight line. Bills fluctuate with billing cycles and seasons, production swings with daylight and weather, and the numbers that matter most are the ones tracked over a full twelve months, not a single month in isolation.
Curious what a realistic first-year estimate would look like for your home? Request a free estimate and see projected production based on your actual roof and usage.
