

Introduction
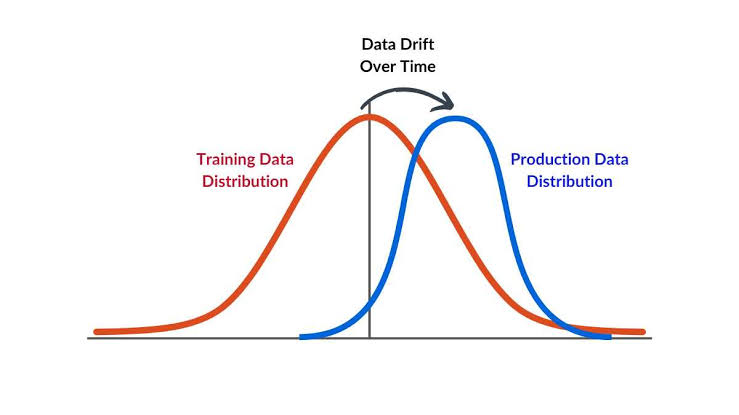
A fraud detection model trained on transaction data from 2022 may perform poorly by 2024 — not because it was poorly built, but because fraudulent behavior has evolved. A demand forecasting model for a retail chain may lose accuracy after a new competitor enters the market. In both cases, the model has not changed. The world has. This phenomenon — where the statistical relationship between input features and the target variable shifts over time — is called concept drift. In machine learning systems that process continuous, real-time data streams, detecting and responding to drift is not optional maintenance. It is a core operational requirement. For any learner in a structured data analytics course that addresses production machine learning, concept drift represents one of the most practically significant topics between the classroom and real deployment.
What Concept Drift Is — and Why Streaming Data Makes It Critical
In a static machine learning setting, a model is trained once on a fixed dataset and evaluated on a held-out test set drawn from the same distribution. The underlying assumption is that the relationship between features and labels remains stable. This is called the stationarity assumption, and it holds reasonably well for many closed, controlled prediction problems.
Streaming data breaks this assumption systematically. When a model receives data continuously — from financial transactions, sensor networks, clickstreams, or social media feeds — the distribution generating that data is subject to ongoing change. Concept drift refers specifically to changes in the conditional distribution P(Y|X): the relationship between input features X and the target label Y. This is distinct from data drift, which refers to changes in the marginal distribution of the inputs P(X) alone.
Concept drift manifests in several forms, each with different detection and response requirements:
- Sudden drift: An abrupt shift in the target relationship, such as a regulatory change that instantly redefines what constitutes a compliant financial transaction.
- Gradual drift: A slow, continuous shift over time, such as evolving consumer preferences that incrementally erode a recommendation model’s relevance.
- Recurring drift: Seasonal or cyclical patterns where previously observed distributions re-emerge, such as purchasing behavior during annual sale periods.
- Incremental drift: A steady, monotonic trend, such as a sensor’s output gradually shifting as hardware ages.
A 2021 survey published in ACM Computing Surveys reviewed over 100 production machine learning systems and found that concept drift was the primary cause of model degradation in more than 60% of cases — underscoring why detection mechanisms must be built into any streaming analytics pipeline from the outset.
Detection Methods: Statistical Tests and Algorithmic Monitors
Concept drift detection methods fall into two broad categories: those that monitor model error rates directly, and those that monitor the statistical properties of the data itself.
Error-rate monitoring methods track a model’s predictive performance over time using a sliding window of recent predictions and their ground-truth labels. When error rates exceed a defined threshold — or increase significantly relative to a baseline — drift is flagged.
The most widely cited algorithm in this category is DDM (Drift Detection Method), introduced by Gama et al. in 2004. DDM models the cumulative error rate as a binomial process and raises a warning when the error rate plus its standard deviation exceeds a warning threshold. If the rate continues rising past a second, stricter threshold, drift is declared and the model is flagged for retraining. A refinement, EDDM (Early Drift Detection Method), is more sensitive to gradual drift by monitoring the distance between classification errors rather than their raw rate — making it better suited for slow behavioral shifts.
ADWIN (Adaptive Windowing), developed by Bifet and Gavalda in 2007, takes a different approach. It maintains a variable-length window over recent data and uses a statistical test to determine whether the mean of the target variable in the older half of the window differs significantly from the newer half. When a significant difference is found, the older portion is discarded, and the window adapts to reflect only the current distribution. ADWIN is theoretically well-grounded, computationally efficient for streaming use, and does not require specifying window size in advance — a meaningful practical advantage.
Distribution-based methods monitor changes in the data distribution itself, without requiring labeled ground truth. Techniques include the Kolmogorov-Smirnov test — a non-parametric statistical test that compares two distributions — and Population Stability Index (PSI), which is widely used in financial services to monitor whether the distribution of model input features has shifted enough to warrant re-evaluation. PSI values below 0.1 indicate stable distributions; values above 0.25 signal significant shift requiring model review.
Real-life use case: PayPal’s fraud detection infrastructure processes over 15 million transactions daily across dozens of countries. Fraud patterns shift seasonally, geographically, and in response to new attack vectors. PayPal has publicly documented the use of drift monitoring systems that compare rolling feature distributions against baseline distributions weekly, automatically triggering model review when PSI thresholds are exceeded — a process that reduced the lag between fraud pattern emergence and model response from weeks to days.
This is the kind of operational context that participants in a data analyst course benefit from examining directly — drift detection is not a theoretical concern but an engineering discipline embedded in production pipelines at scale.
Responding to Drift: Retraining Strategies and Adaptive Models
Detecting drift is only the first half of the problem. Once drift is identified, the model must respond — and the appropriate response depends on the type and severity of the drift detected.
Full retraining on the most recent window of labeled data is the most straightforward response and appropriate for sudden drift, where the old distribution is no longer relevant. The primary challenge is ensuring sufficient recent labeled data is available, which may not always be the case immediately following a distributional shift.
Incremental learning updates the model continuously as new labeled data arrives, without discarding prior learning entirely. Algorithms like Hoeffding Trees — decision trees designed specifically for streaming data — update their structure incrementally with each new example. This is computationally efficient but requires careful control to prevent over-adaptation to noise rather than genuine drift.
Ensemble-based approaches maintain multiple models trained on different temporal windows and weight their predictions by recency or recent accuracy. DWMIL (Dynamic Weighted Majority) and Learn++.NSE are documented ensemble methods designed specifically for non-stationary environments, where more recent models receive higher weight when drift is detected and older models recover weight during recurring drift cycles.
Real-life use case: Electricity demand forecasting provides a well-documented case of recurring and gradual drift. Australian energy grid operator AEMO uses adaptive forecasting systems that recalibrate model weights weekly using recent consumption data, with drift monitors that separately track temperature-adjusted demand — a baseline that controls for seasonal patterns — to isolate genuine behavioral shifts from predictable cyclical variation. Published evaluations show that adaptive models reduce mean absolute percentage error by 12–18% compared to static models retrained only quarterly.
The practical discipline of selecting an appropriate retraining strategy — balancing responsiveness to drift against the risk of overfitting to noise — is a skill that any comprehensive data analytics course covering production machine learning should address explicitly.
Concluding Note
Concept drift represents one of the clearest gaps between how machine learning is taught and how it operates in production. Models trained on static datasets under stationarity assumptions will degrade predictably when deployed in environments where data distributions evolve — which is to say, most real environments. Sudden, gradual, recurring, and incremental drift each require different detection sensitivities and retraining strategies, and the field has produced well-validated methods — DDM, ADWIN, PSI-based monitoring, ensemble adaptation — for each scenario.
The core discipline is not simply knowing these algorithms but building the monitoring infrastructure that makes drift visible before it causes measurable harm. For learners working through a data analyst course with a focus on applied machine learning, concept drift detection is an essential bridge between model development and model operations — a domain where statistical knowledge, engineering awareness, and operational judgment converge into a single, continuously running responsibility.
Business name: ExcelR – Data Science, Data Analytics Course Training in Pune
Address: 101 A ,1st Floor, Siddh Icon, Baner Rd, opposite Lane To Royal Enfield Showroom, beside Asian Box Restaurant, Baner, Pune, Maharashtra 411069
Phone: 098809 13504
