

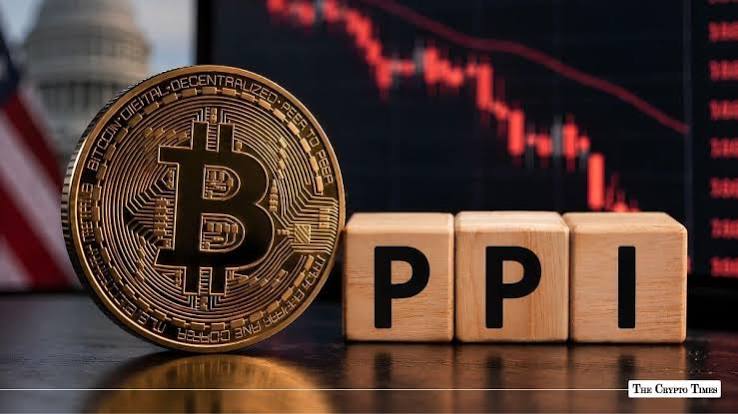
US Producer Inflation Surges 1.3% as Energy Prices Fuel Pressure
US wholesale inflation accelerated sharply in September 2026, delivering the largest monthly gain in producer prices in four and a half years and the biggest annual increase since late 2022. The Producer Price Index for final demand rose 1.3 percent from August and climbed 6.3 percent over the prior twelve months, according to the Bureau of Labor Statistics. Energy prices accounted for the bulk of the advance, with gasoline jumping more than 20 percent in a single month amid ongoing supply disruptions linked to conflict in the Middle East. The data arrived one day after a hotter-than-expected consumer price reading and briefly pressured risk assets, including Bitcoin, which slipped under the $80,000 level before rebounding.
Markets digested the report as further evidence that inflation pressures remain broad, even as core measures excluding food and energy also ran hotter than forecasts. The combination has kept Federal Reserve policy firmly in focus ahead of the central bank’s late-October meeting, with traders weighing the likelihood of additional rate increases later in the year. Bitcoin’s ability to recover above $80,000 after the initial sell-off highlighted both the sensitivity of digital assets to macroeconomic surprises and the resilience of buying interest near key psychological levels. The latest wholesale price surge underscores how energy shocks continue to feed through the production chain and into broader inflation metrics at a time when Bitcoin has reclaimed ground above $80,000 following a sharp intraday test of support.
Energy Costs Drive Largest Monthly PPI Gain Since Early 2022
Final demand producer prices advanced 1.3 percent in September after an upwardly revised 0.5 percent rise in August, marking the steepest monthly increase since March 2022. Goods prices led the move with a 2.6 percent jump, the largest since the series began in late 2009, while services rose 0.8 percent. Energy alone surged 10.8 percent and explained more than 80 percent of the goods increase. Gasoline prices climbed 20.3 percent, and diesel advanced at a similar pace, reflecting elevated crude costs and refining constraints tied to shipping risks in key Middle East waterways. The annual PPI reading reached 6.3 percent, the highest since December 2022 and well above the 5.5 percent consensus. Economists had expected a more moderate 0.5 to 0.6 percent monthly gain. The breadth of the increase, extending beyond pure energy into trade margins and transportation, signals that higher input costs are beginning to appear further down the production pipeline.
Officials at the Bureau of Labor Statistics noted that prices for final demand, less food, energy, and trade services still advanced 0.5 percent in the month and 5.0 percent over the year, confirming underlying pressure remains elevated. These figures arrive against a backdrop of elevated oil benchmarks, with West Texas Intermediate trading near $99 and Brent above $105 in mid-October as supply concerns persist. The energy-driven component of the PPI report has already fed into higher retail gasoline prices, which in turn supported headline consumer spending readings even as underlying demand showed signs of moderation. For producers, the sharp rise in input costs raises questions about margin pressure in coming months if they cannot fully pass those increases through to customers. Market participants watching the Bitcoin price closely noted the immediate reaction of risk assets to the data, illustrating how tightly crypto markets remain linked to inflation surprises that alter the expected path of monetary policy.
Core Producer Prices Also Accelerate Beyond Forecasts
Excluding food and energy, the core PPI rose 0.7 percent month over month and 5.0 percent year over year, both readings exceeding expectations of roughly 0.3 percent and 4.4 to 4.5 percent. The core advance was the largest monthly gain since April and pushed the annual rate to its highest level since early 2023. When trade services are also stripped out, the residual measure still increased 0.5 percent on the month and matched recent peaks near 5.0 percent annually. These underlying figures matter because they feed into the Federal Reserve’s preferred inflation gauges and reduce the chance that policymakers will dismiss the headline strength as purely energy-related.
Transportation and warehousing services jumped 3.4 percent, while trade margins expanded 1.4 percent, pointing to higher distribution costs that could eventually appear in consumer prices. The persistence of core pressure complicates the narrative that inflation is confined to volatile categories. Businesses face higher costs for intermediate goods and services at the same time that consumer energy bills remain elevated. This combination has already contributed to revisions in some private forecasts for year-end policy rates. Bitcoin’s rebound above $80,000 after the initial dip suggests that some market participants viewed the sell-off as an opportunity rather than a fundamental shift in the asset’s medium-term outlook. Still, sustained core readings near 5 percent keep the door open for additional monetary tightening if subsequent data fail to show cooling.
Bitcoin Briefly Breaks Below $80,000 Before Recovering
Bitcoin traded near $80,900 just before the 8:30 a.m. Eastern release and slipped roughly 0.4 percent within minutes, touching levels near $80,580 and briefly trading under the $80,000 psychological mark. Intraday lows approached $79,800 on some venues as liquidations mounted. The move extended a pre-existing decline that had already left the cryptocurrency down nearly 3 percent on the session. Within hours, however, buying interest returned and prices recovered toward $82,000, later settling in a range near $81,000 to $82,000 in subsequent sessions. Liquidation data showed hundreds of millions of dollars in positions closed, with long positions accounting for the majority of the forced selling.
The rapid recovery highlighted the depth of support near the round-number level that had held through much of September and early October. Trading volume spiked during the volatility, consistent with the pattern seen around previous high-impact economic releases. Analysts monitoring order-book depth noted concentrated liquidation clusters around $80,000 that amplified the initial move lower once that area was breached. The episode reinforced Bitcoin’s continued sensitivity to shifts in rate expectations even as longer-term holders appeared less willing to sell into the dip. Price action in the days that followed showed the market stabilizing above the contested zone, with daily closes remaining north of $81,000.
Middle East Supply Disruptions Amplify Energy Price Pressure
The energy component of the PPI report cannot be separated from ongoing geopolitical tensions that have constrained oil flows through critical shipping lanes. Attacks and heightened risks around the Strait of Hormuz have reduced throughput relative to pre-conflict baselines, elevating freight and insurance costs and supporting crude prices that have hovered near or above $100 per barrel for extended periods. Gasoline and diesel price spikes in the domestic market followed directly from these supply constraints and higher wholesale energy costs. The 10.8 percent monthly surge in final-demand energy prices was described by several analysts as among the largest on record for the series.
These cost pressures feed into both producer and consumer inflation measures with a lag, meaning the September PPI print may continue to influence subsequent consumer price readings. Higher energy input costs also raise the risk of secondary effects in categories such as transportation services and food manufacturing. For crypto markets, energy-driven inflation tends to strengthen the case for tighter monetary policy, which in turn can pressure valuations of risk assets. Bitcoin’s ability to absorb the initial shock and rebound has therefore been interpreted by some observers as evidence that structural demand for the asset remains intact even when short-term rate expectations shift higher.
Federal Reserve Policy Path Comes Back Into Focus
The dual surprise of hotter CPI and PPI readings revived discussion of whether the Federal Reserve might need to raise rates sooner than previously anticipated. Odds of a 25-basis-point move at the October 27-28 meeting rose after the CPI report before partially retreating following the PPI release and subsequent comments from policymakers. Market pricing still assigns a higher probability to a hold in October and a greater chance of action by the December meeting. Officials have emphasized data dependence, noting that energy shocks complicate the assessment of underlying inflation trends.
Core measures remaining well above the 2 percent target leave little room for complacency. The Fed’s preferred inflation gauges incorporate elements of both the CPI and PPI, so sustained strength in producer prices increases the likelihood that those gauges will remain elevated in coming months. Bitcoin traders have historically reacted to shifts in the expected policy path, with higher-for-longer rate scenarios typically associated with periods of price consolidation or correction. The current rebound above $80,000 occurs against a backdrop of still-elevated real yields and a dollar that has fluctuated with changing rate odds.
Retail Sales Receive Temporary Boost From Higher Fuel Prices
Concurrent retail sales data showed a solid headline gain that was partly attributable to the same higher gasoline prices that drove the PPI higher. Underlying sales excluding autos and gasoline appeared more subdued, pointing to some softening in discretionary spending. The combination of rising wholesale costs and only moderate real demand growth creates a challenging environment for businesses that must decide how much of the cost increase to absorb versus pass along.
This dynamic has implications for profit margins across manufacturing and distribution sectors. If producers succeed in raising prices, the resulting consumer inflation could keep the Fed on a tighter path for longer. Crypto markets often interpret such developments through the lens of liquidity conditions and opportunity costs of holding non-yielding assets. Bitcoin’s price recovery after the initial PPI reaction suggests that some capital continues to view digital assets as a portfolio diversifier even when traditional risk assets face pressure from higher rate expectations.
Liquidations and Volatility Highlight Leverage in Crypto Markets
The brief break below $80,000 triggered substantial liquidations estimated in the hundreds of millions of dollars within a short window. Long positions bore the majority of the forced closures, consistent with the positioning that had built up during the preceding recovery phase. Volatility expanded as stop orders and cascading liquidations interacted with thinner liquidity around the psychological level. Once the forced selling exhausted itself, the market found buyers willing to step in at lower prices. Such episodes underscore the continued presence of leveraged trading in Bitcoin futures and perpetual markets.
While the recovery was relatively swift, the episode serves as a reminder that macroeconomic surprises can still generate outsized moves when positioning is crowded. Traders monitoring how crypto futures leverage works or related risk-management concepts often point to these events as case studies in the importance of position sizing around high-impact data releases. The subsequent stabilization above $80,000 has reduced immediate downside pressure, yet elevated implied volatility remains a feature of the current environment.
Market Reaction Mixes Rate Concerns With Risk Appetite
Equity indexes and other risk assets registered mixed responses to the dual inflation surprises, with some sectors sensitive to higher rates underperforming while energy-related shares benefited from the same price surge that drove the PPI higher. Treasury yields fluctuated as markets recalibrated the expected policy path. The dollar experienced periods of strength followed by partial retracement as the probability of an October hike declined from its post-CPI peak.
Bitcoin’s correlation with traditional risk assets remains elevated during periods of macro uncertainty, yet its independent recovery path after the PPI release illustrated pockets of resilient demand. Institutional flows and exchange-traded product activity continue to provide a structural bid that was less evident in earlier market cycles. The ability of the Bitcoin market to reclaim the $80,000 area so quickly after a high-profile inflation miss has been cited by some analysts as evidence that the asset is maturing in its response to conventional macroeconomic shocks.
Historical Context Places Current PPI Reading in Perspective
The 1.3 percent monthly gain ranks among the largest in the post-pandemic period and exceeds most readings recorded during the 2021-2022 inflation peak outside of the most extreme months. The annual rate of 6.3 percent returns the index to levels last seen when the Federal Reserve was still in the early stages of its previous tightening cycle. Comparisons with earlier energy-driven spikes show that secondary effects on core inflation can persist for several months after the initial shock.
For digital assets, the current episode differs from prior inflation cycles in the scale of institutional participation and the availability of regulated investment vehicles. Bitcoin’s market capitalization and liquidity depth are substantially higher than during previous periods of elevated producer price inflation, which may help explain the relatively contained nature of the sell-off and the speed of the rebound. Still, the absolute level of inflation remains inconsistent with the Fed’s longer-term target, keeping policy uncertainty elevated.
Rising Production Costs Put Pressure on Multiple Industries
Manufacturers, transporters, and retailers face a renewed period of cost pressure that could affect inventory decisions and pricing strategies into the final months of the year. Categories such as industrial chemicals, certain metals, and logistics services have already registered secondary increases. If these pressures persist, the pass-through to consumer prices could keep both CPI and PCE inflation readings elevated even after the direct energy contribution moderates.
Businesses operating with thin margins or limited pricing power are most exposed. The data also complicate capital expenditure plans that rely on stable input costs. Crypto markets, while not directly tied to industrial production, respond to the second-order effects on monetary policy and overall financial conditions. The rebound in Bitcoin above $80,000 has occurred alongside continued debate about whether the latest inflation readings represent a temporary energy shock or a more persistent reacceleration.
Market Participants Assess Probability of Further Rate Increases
Forecasts for the remainder of 2026 have shifted toward a greater likelihood of at least one additional quarter-point increase by year-end, with December currently carrying higher odds than October. Private-sector economists have revised some projections upward following the consecutive CPI and PPI surprises. The path of core inflation and labor market data in the intervening weeks will determine whether policymakers feel compelled to act sooner.
Bitcoin traders continue to monitor these probability shifts closely because changes in the discount rate applied to future cash flows and the opportunity cost of holding non-yielding assets can influence capital allocation decisions. The current price recovery suggests that a meaningful portion of the market is prepared to look through near-term policy uncertainty, provided that longer-term adoption trends and supply dynamics remain supportive. Volatility around subsequent data releases is likely to remain elevated until a clearer policy trajectory emerges.
Bitcoin’s Support Levels and Technical Backdrop After the Volatility
Technical analysts have identified the $80,000 area as a key zone that attracted both stop-loss selling and subsequent value buying. Moving averages on intermediate time frames and prior consolidation ranges have provided reference points for the rebound. Open interest in futures markets declined during the liquidation event before stabilizing, a pattern often associated with the clearing of excess leverage.
The speed of the recovery has left some momentum indicators in neutral territory rather than deeply oversold, suggesting that further consolidation or a measured advance could follow if macroeconomic data stabilize. Traders focused on differences between isolated and cross margin or related risk frameworks often emphasize the importance of managing exposure around levels that have repeatedly attracted both buyers and sellers. The fact that Bitcoin has held above the contested zone in subsequent sessions has reduced the immediate risk of a deeper corrective move, though the broader inflation backdrop continues to set the tone for risk appetite.
FAQsHow significant was the September 2026 PPI increase compared with recent history?
The 1.3 percent monthly rise represented the largest advance since March 2022, while the 6.3 percent annual increase was the highest since December 2022. Energy prices drove the majority of the goods component, with gasoline alone rising more than 20 percent. Core measures excluding food and energy also accelerated, confirming that pressure extended beyond volatile categories. These readings arrived against a backdrop of elevated crude oil prices linked to ongoing supply risks in the Middle East.
Why did Bitcoin fall below $80,000 after the PPI report?
Higher-than-expected inflation data raised the probability that the Federal Reserve might keep interest rates higher for longer or raise them again, increasing the opportunity cost of holding non-yielding assets such as Bitcoin. The cryptocurrency was already trading lower on the day, and the data release triggered additional selling and liquidations that briefly pushed prices under the psychological $80,000 level before buyers returned.
What role did energy prices play in the PPI surge?
Final-demand energy prices rose 10.8 percent in September, accounting for more than 80 percent of the increase in goods prices. Gasoline and diesel registered gains exceeding 20 percent in some measures. These moves reflected higher crude costs and elevated shipping and insurance expenses associated with geopolitical tensions affecting Middle East oil flows.
How have Federal Reserve rate-hike odds changed after the inflation data?
Odds of a rate increase at the October meeting rose after the CPI report and then moderated somewhat following the PPI release and subsequent policymaker comments. Markets currently assign a higher probability to a hold in October and an increased chance of action by the December meeting. Core inflation remaining elevated continues to support expectations of at least one additional hike by year-end.
Did the PPI data affect other financial markets?
Treasury yields fluctuated as rate expectations adjusted, the dollar experienced periods of strength, and equity markets showed mixed sector performance, with energy shares benefiting while rate-sensitive areas lagged. Retail sales received a temporary boost from higher gasoline prices even as underlying demand appeared more moderate.
Disclaimer: This content is for informational purposes only and does not constitute investment advice. Cryptocurrency investments carry risk. Please do your own research (DYOR).
